
Solar Power Predictor
Solar Power Predictor
About the Model
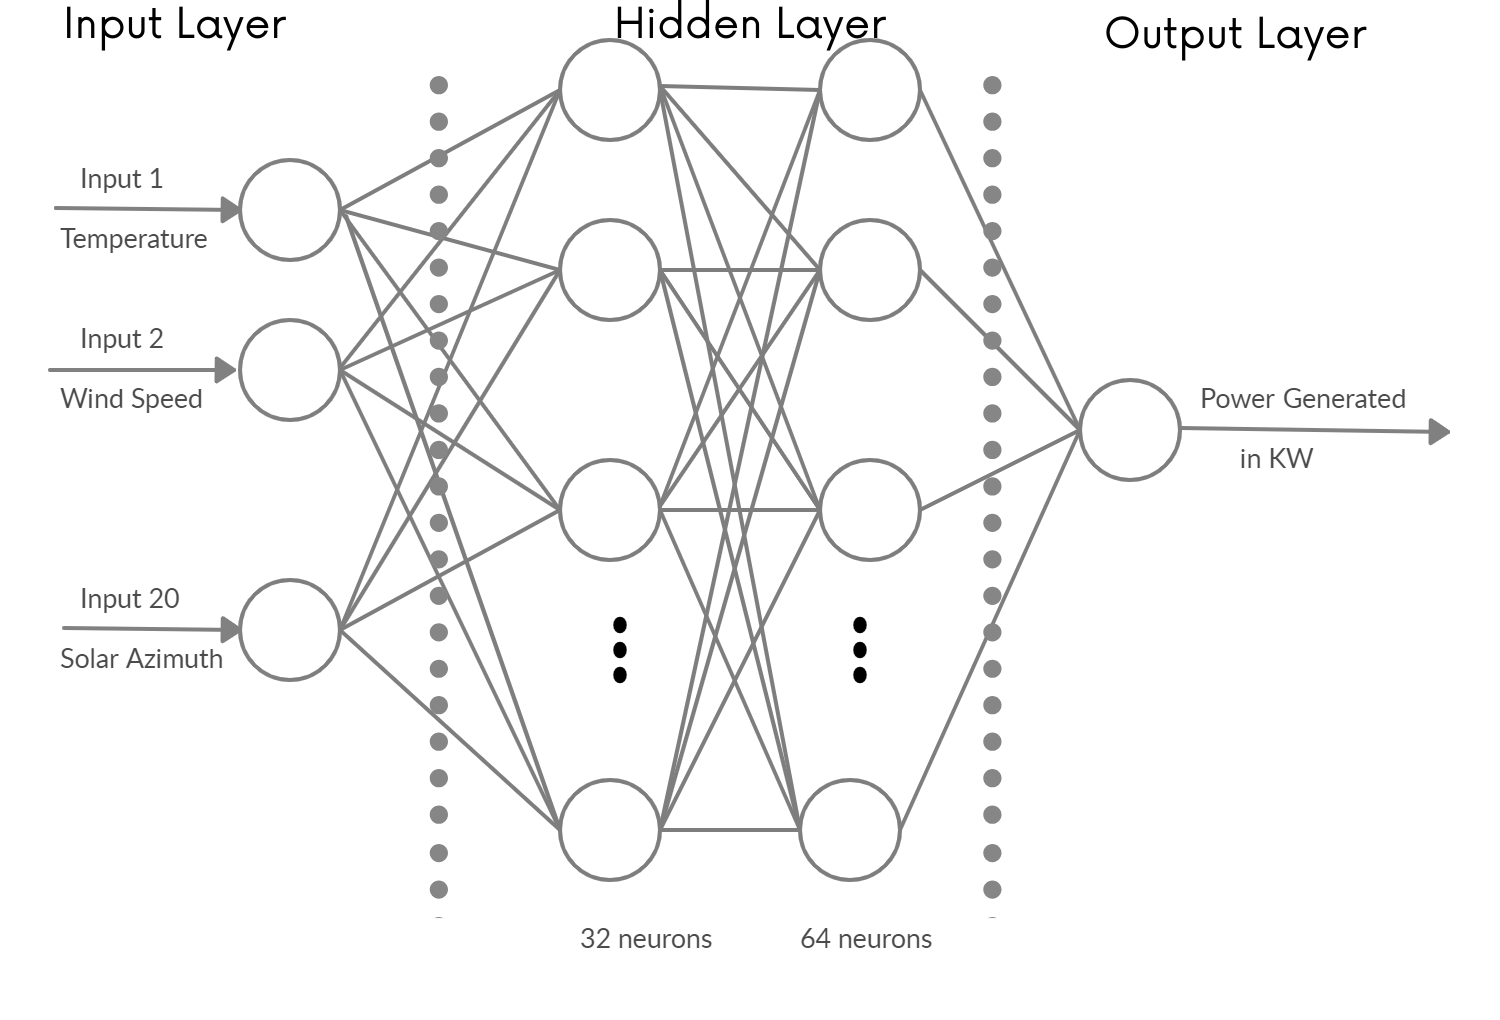
Purpose: The model predicts solar power generation based on various input features.
Model Input Parameters
| Parameter | Unit |
|---|---|
| Temperature at 2 meters above the ground | Celsius |
| Relative humidity at 2 meters above the ground | Percentage |
| Mean sea level pressure | Hectopascals (hPa) or millibars (mb) |
| Total precipitation at the surface | Millimeters or liters per square meter |
| Snowfall amount at the surface | Centimeters |
| Total cloud cover at the surface | Percentage |
| High-level cloud cover in the high cloud layer | Percentage |
| Medium-level cloud cover in the mid-level cloud layer | Percentage |
| Low-level cloud cover in the low cloud layer | Percentage |
| Shortwave radiation at the surface | Watts per square meter |
| Wind speed at 10 meters above the ground | Meters per second |
| Wind direction at 10 meters above the ground | Degrees(0-360) |
| Wind speed at 80 meters above the ground | Meters per second |
| Wind direction at 80 meters above the ground | Degrees(0-360) |
| Wind speed at 900 millibars (mb) pressure level | Meters per second |
| Wind direction at 900 millibars (mb) pressure level | Degrees(0-360) |
| Wind gust at 10 meters above the ground | Meters per second |
| Angle of incidence (specific to solar radiation) | Degrees |
| Solar zenith angle (specific to solar radiation) | Degrees |
| Solar azimuth angle (specific to solar radiation) | Degrees |
| Generated solar power | Watts |
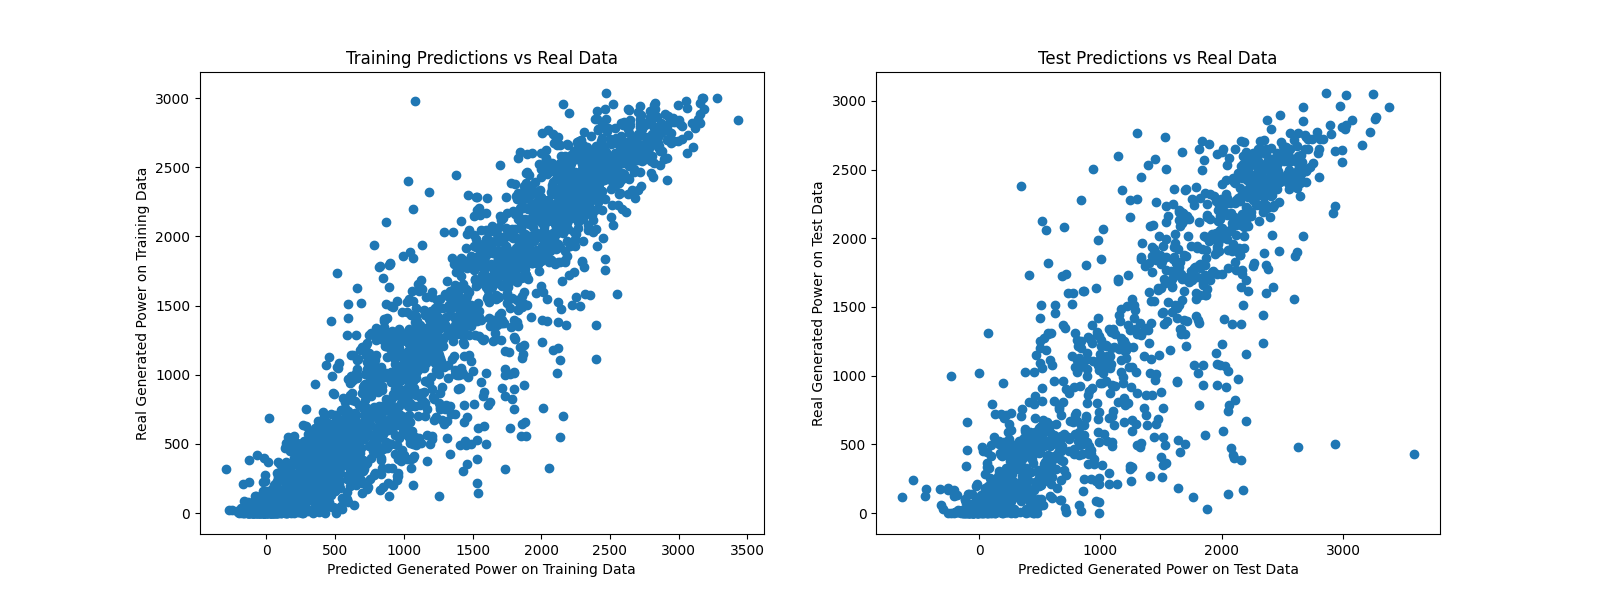
Model Results
Comparison between Predicted and Real Generated Power.
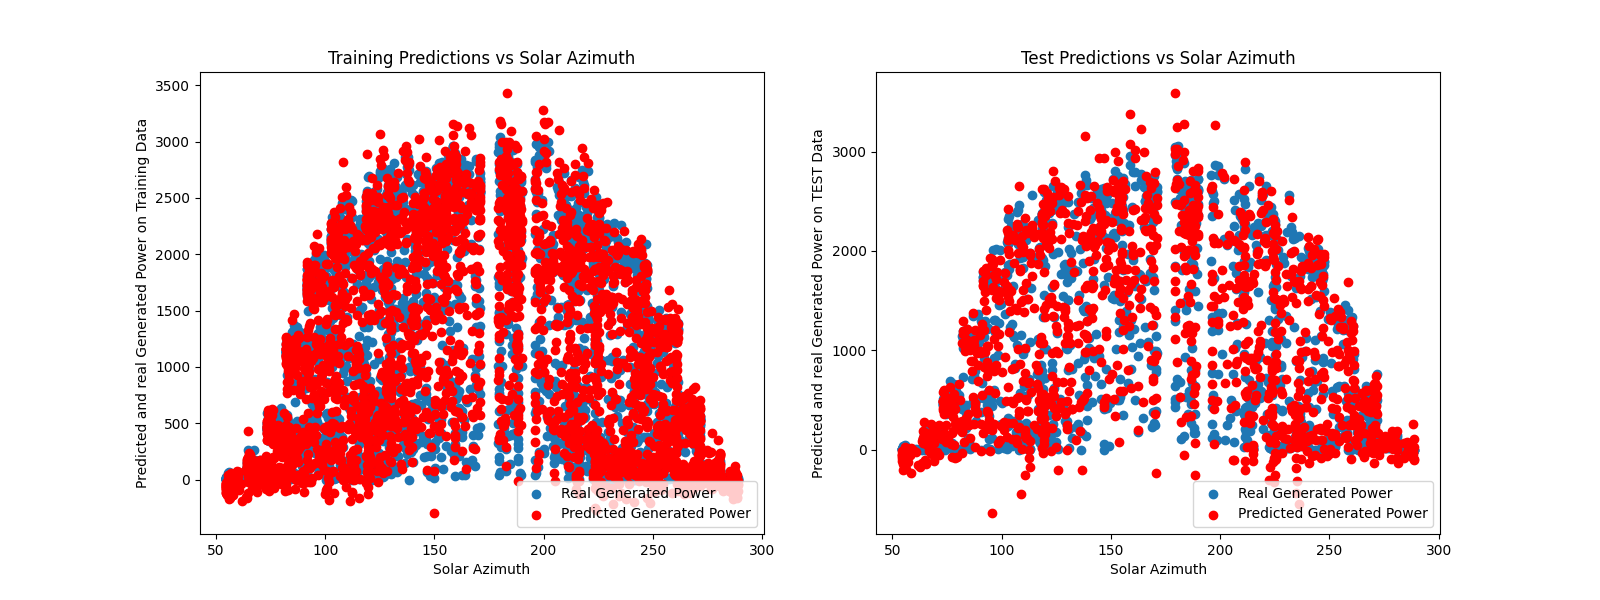
Comparison of Solar Azimuth with Predicted and Real Generated Power.
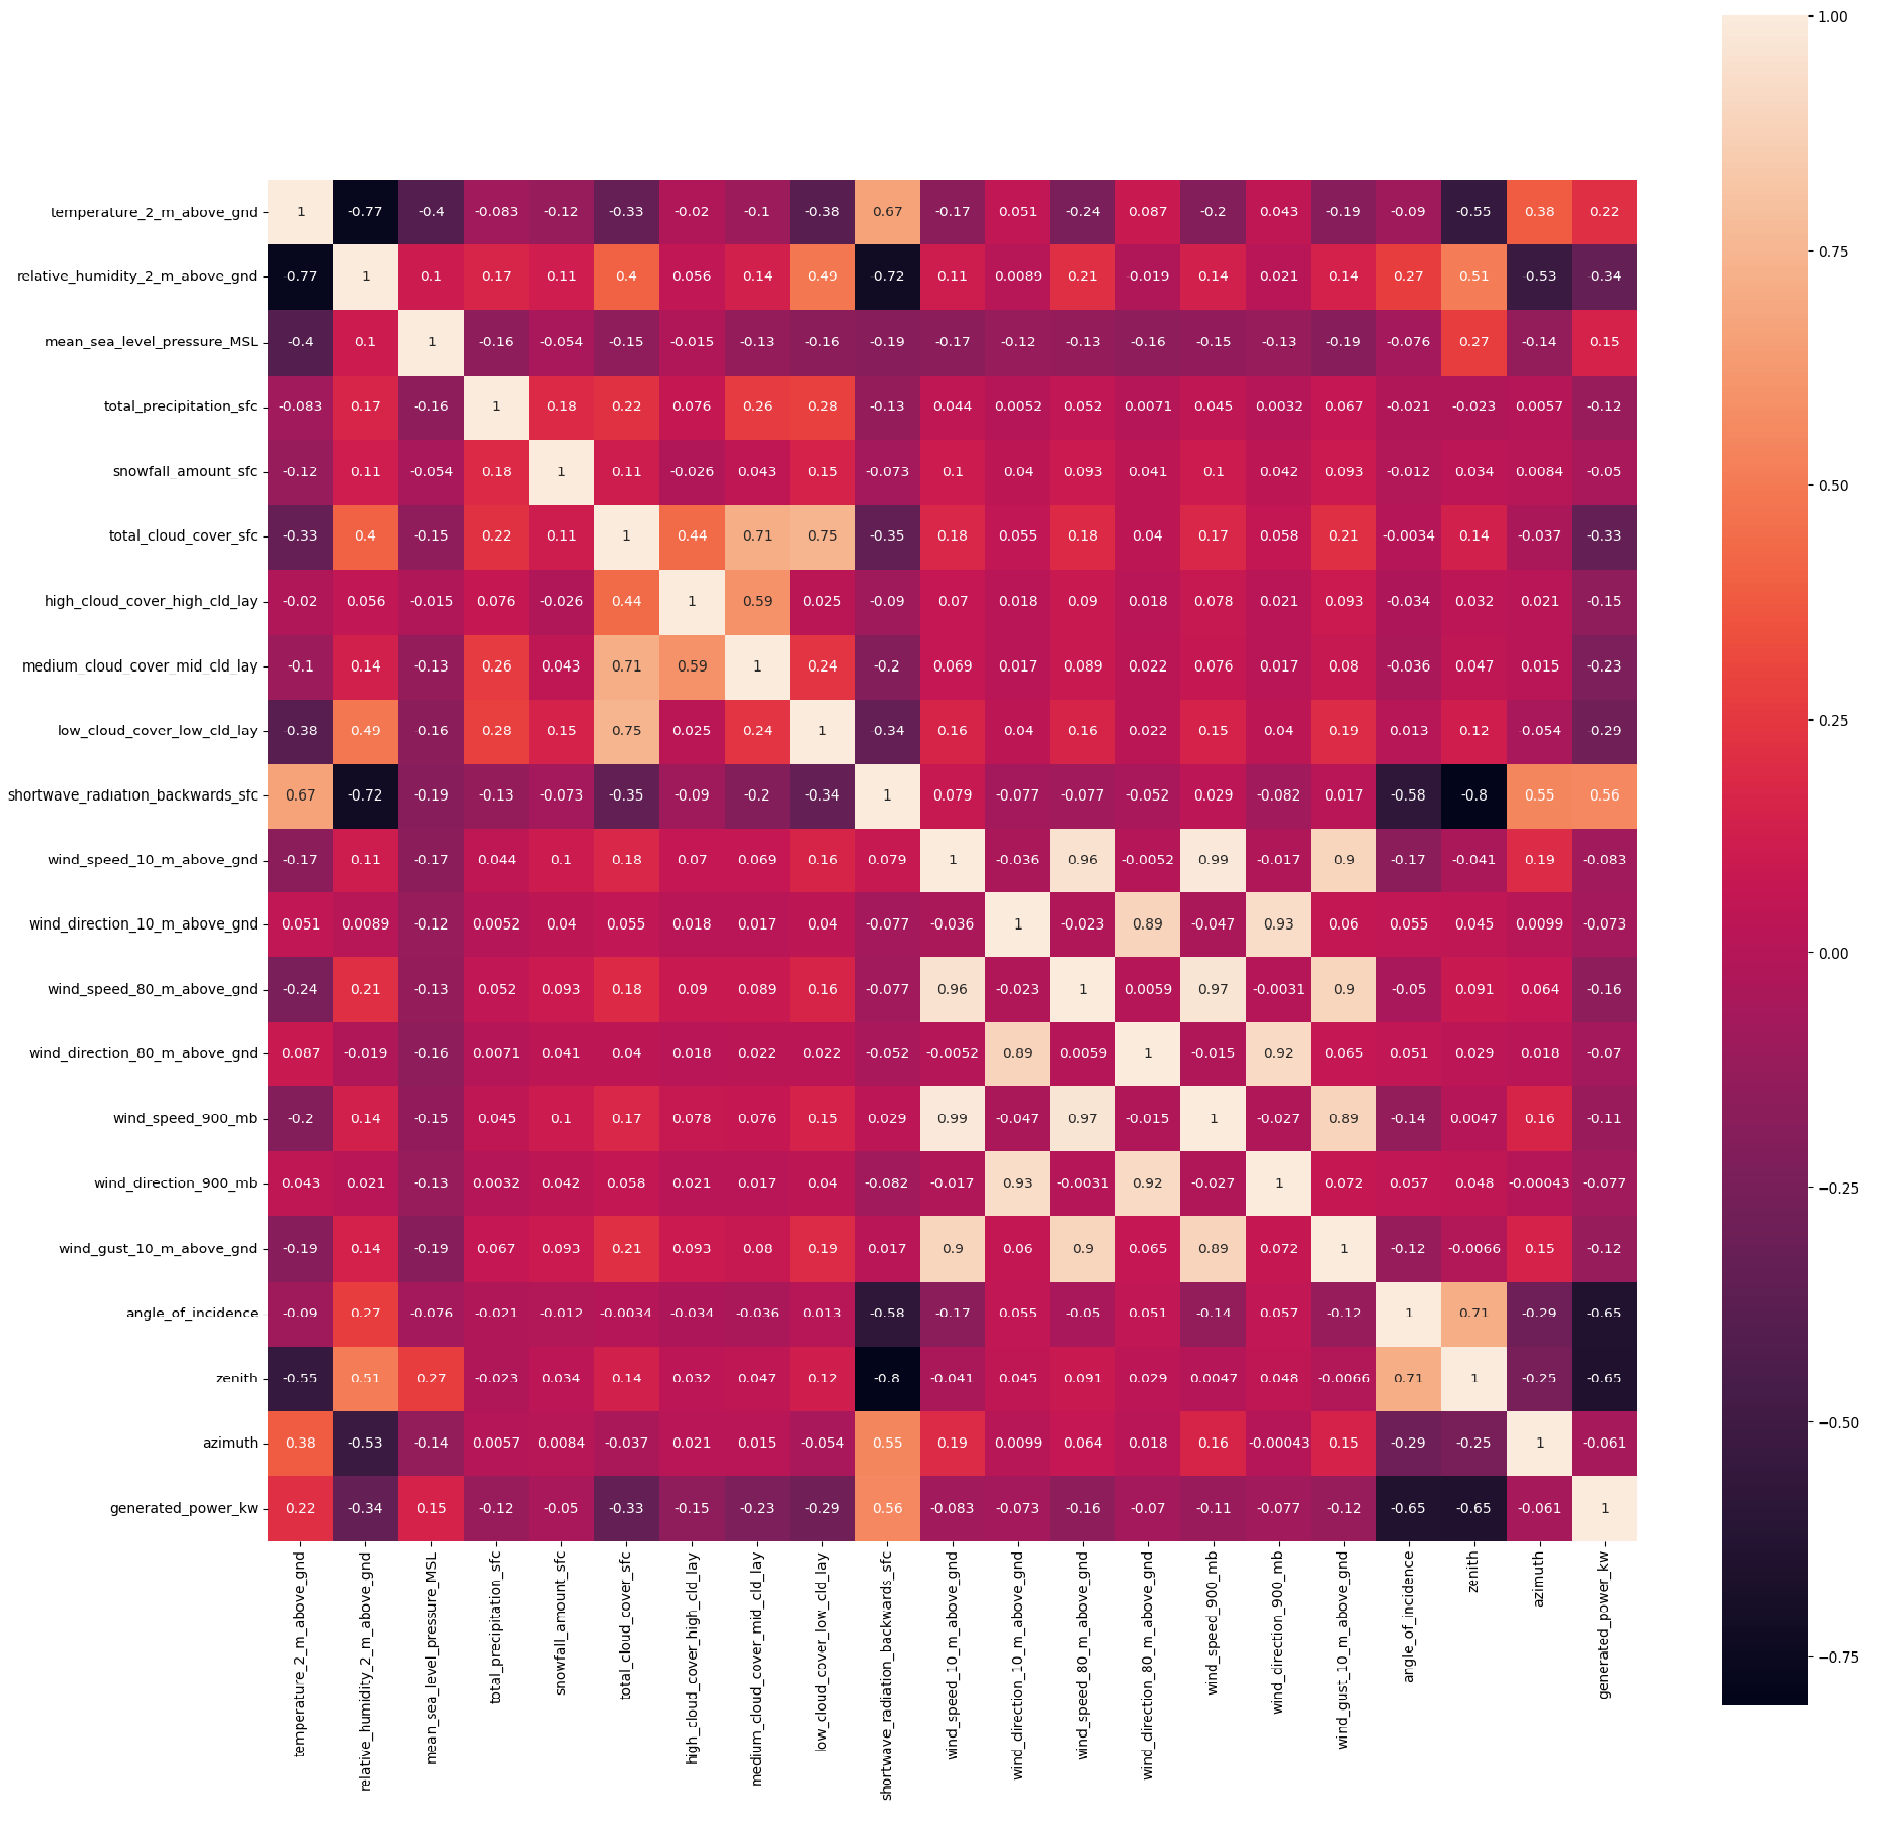
Correlation Heatmap: Understanding Relationships in the Dataset
A heatmap is a graphical representation of data where individual values contained in a matrix are represented as colors. It is a way of visualizing data in a 2D space, where the values of each matrix element are represented as colors. Heatmaps are particularly useful for showing the correlation or distribution of values across two dimensions
Model statistics
R-squared (R2) score : The R-squared (R2) score is a metric used in regression analysis to assess how well a model's predictions align with the observed data. Ranging from 0 to 1, a higher R2 indicates a better fit, with 1 representing a perfect fit and 0 indicating no improvement over a mean-based model. The score quantifies the proportion of variance in the dependent variable explained by the independent variables. It is valuable for comparing models and assessing their predictive power. However, limitations exist, and complementary metrics should be considered for a comprehensive evaluation of regression models.
Mean of Test Set:
Standard Deviation of Test Set:
Relative Standard Deviation (Coefficient of Variation):
| Statistic | Value |
|---|---|
| R2 Score of Whole Data Frame | 0.867086 |
| R2 Score of Training Set | 0.913460 |
| R2 Score of Test Set | 0.761501 |
| Mean of Test Set | 1092.545532 |
| Standard Deviation of Test Set | 896.916748 |
| Relative Standard Deviation | 0.820942 |
Feature importance : Feature importance is a concept in machine learning that quantifies the contribution of each input variable (feature) to the model's predictive performance. It helps identify the most influential features in making accurate predictions. Techniques such as tree-based models (e.g., decision trees, random forests) and algorithms like permutation importance are commonly used to assess feature importance. High importance values suggest that a feature has a significant impact on the model's ability to make accurate predictions, aiding in understanding the key drivers behind the model's decision-making process. Feature importance is valuable for feature selection, model interpretation, and enhancing overall model understanding.
| Feature Importance | Value |
|---|---|
| Temperature at 2 meters above the ground | -0.0831202095 |
| Relative humidity at 2 meters above the ground | -0.1060344323 |
| Mean sea level pressure | 0.1176043104 |
| Total precipitation at the surface | -0.0019499833 |
| Snowfall amount at the surface | 0.0122035206 |
| Total cloud cover at the surface | -0.0853682636 |
| High-level cloud cover in the high cloud layer | -0.0275538812 |
| Medium-level cloud cover in the mid-level cloud layer | -0.0449632463 |
| Low-level cloud cover in the low cloud layer | -0.0450913885 |
| Shortwave radiation at the surface | 0.3800936371 |
| Wind speed at 10 meters above the ground | 0 |
| Wind direction at 10 meters above the ground | 0.0105151165 |
| Wind speed at 80 meters above the ground | 0.0538507705 |
| Wind direction at 80 meters above the ground | 0.0150801662 |
| Wind speed at 900 millibars (mb) pressure level | -0.106695277 |
| Wind direction at 900 millibars (mb) pressure level | 0 |
| Wind gust at 10 meters above the ground | -0.01625386 |
| Angle of incidence | -0.4405263372 |
| Solar zenith angle | -0.1431061976 |
| Solar azimuth angle | -0.4310704873 |